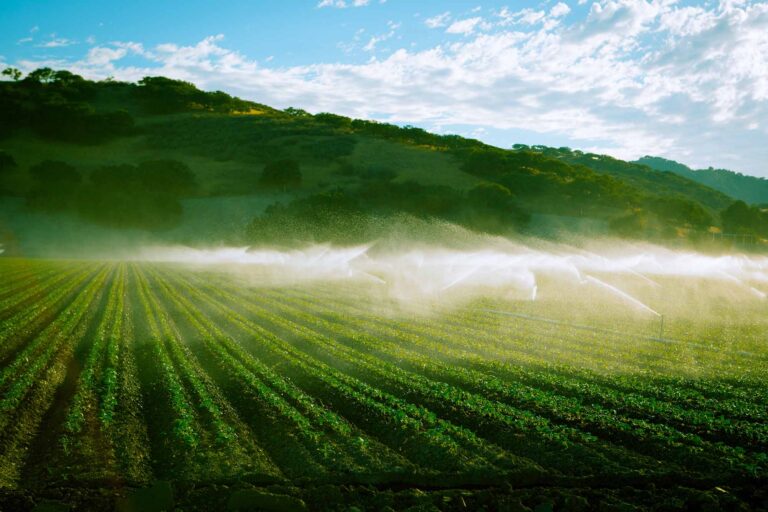
- California’s agriculture sector produces over 400 commodities, generates more than $50 billion in annual revenue, and employs over 420,000 people. Most farm revenue comes from irrigated crops.
- Irrigated farmland is concentrated in the San Joaquin Valley (54% of the state total), the Sacramento Valley (21%), the North, Central, and South coasts (9%), and the southeast desert region (6%).
- Farms use both surface water and groundwater. In recent decades, reductions in surface water—a result of drier conditions and changes in environmental regulations—have prompted more groundwater use.
- Chronic overpumping of groundwater causes negative impacts such as dry wells and land subsidence. The 2014 Sustainable Groundwater Management Act (SGMA) requires water users to address these impacts.
California has a diverse crop mix, but acreage has been shifting to perennials.
- Total irrigated acreage has remained relatively stable since the 1980s, but the potential for high returns has spurred rapid growth in perennial fruit and nut crops (especially almonds), and a decline in field crops like cotton. Perennials increased from 22% of irrigated acreage in 2000 to 46% in 2018.
- Vegetables and berries also generate relatively high returns—and high revenues per unit of water and land.
- Feed crops—including alfalfa, pasture, and corn silage—cover a quarter of acreage and 27% of farm water use. The revenue share from these crops is small (5%), but they support the state’s large livestock industry.
- The shift towards perennials has reduced farmers’ ability to adjust their operations in dry years. Corn acreage is also relatively inflexible because silage needs to be grown near dairies.
California has a diverse crop mix, with wide variations in revenue, water use, and land area

SOURCES: Author calculations using data from the CA Department of Water Resources (2018 LandIQ land cover and 2011–13 average applied water), the USDA National Agricultural Statistics Service (2016–19 average price and crop yield), OpenET, and PRISM.
NOTES: Total 2018 irrigated area was 8.5 million acres. Total 2011–13 water applied to fields was 28.4 maf. Total 2016–19 crop revenues were $42.5 billion; dairy cattle and milk contributed $6.6 billion of value, and other animal production contributed $1.6 billion (USDA ERS). Alfalfa, corn, and irrigated pasture are key inputs for animal production. Field crops include dry beans, cotton, rice, safflower, and sunflowers, among others. Applied water does not sum to 100% because of rounding.
The value gained from agricultural water use continues to rise.
- On average, farms use approximately 40% of the state’s water, or 80% of all water used by homes and businesses. The value of farm output has increased despite little change in total farmed acreage or water used, in large part reflecting the shift towards perennial crops.
- Agriculture’s share of the state economy has fallen over time because non-farm sectors have grown faster. In 2019, agriculture accounted for 14% of regional GDP in the San Joaquin Valley, but only about 2% of state GDP.
- More efficient water delivery and irrigation systems have improved crop yields and quality, reduced water applied per acre, and benefitted water quality. But they have also reduced major sources of groundwater recharge: seepage from unlined canals and excess irrigation.
A warming climate is raising agricultural water demand and reducing supplies.
- Warmer temperatures are raising evaporative demand—or the “thirstiness” of the atmosphere—which increases crop water requirements and decreases runoff and available water supplies.
- Groundwater is an important drought reserve, but overpumping threatens long-term supplies. Groundwater quality is declining due to salt buildup and nitrate from farm runoff.
- The 2020–22 drought contributed to significant cropland fallowing above pre-drought 2018 levels: nearly 400,000 acres in 2021, and 600,000 acres in 2022.
Sustainable farm water management will require a reduction in irrigated acreage.
- Implementing SGMA will require augmenting water supplies, pumping less, and reducing irrigated acreage. In the San Joaquin Valley, this could entail fallowing more than 500,000 acres by the early 2040s.
- Local water agencies can accelerate aquifer recovery by ramping up recharge in dedicated basins and unlined canals, and spreading excess winter flows on farmland. Conveyance infrastructure upgrades will be critical.
- Transparent water markets can provide flexibility. Local trading of groundwater pumping rights can allow continued production of some higher-return crops while compensating farmers who reduce usage.
- Recharge and trading will require good accounting systems and simplified approval processes. Research on improving productivity under low-water conditions can also help farmers manage with less water.
Source: PPIC


